Why data journalism matters for disaster risk reduction and response
14 May 2025
The capacity of public media to reach large audiences with accurate and timely information is underscored in times of crisis. And as climate-related disasters grow more frequent, public broadcasters have continued to find new ways to help keep their audiences safe, both ahead of and in the wake of such emergencies. Leveraging data journalism has become pivotal to these efforts.
As the United Nations Office for Disaster Risk Reduction (UNDRR) stresses, advance warning makes up a crucial aspect of reducing the devastating impact of disasters. Yet, raw disaster data itself is not easily interpreted by the general public. But by translating vast and often complex data into actionable information and more easily understandable formats, public media critically bridges this gap. Through the use of data journalism, it continues to play a core role in promoting safer and informed decision-making in preparation for and during a crisis.
Both academics and journalists warn of the significant risk of disinformation surrounding disaster scenarios, making the role of public broadcasters more vital than ever. With the trust that audiences have in them, and their abilities to verify and communicate at pace and scale, data journalism has become an essential tool to ensure that accurate and life-saving information reaches the public.
In this piece, we explore some of the innovative ways our members have harnessed data journalism to mitigate the risks posed by natural disasters worldwide.
BBC data for hotter days
In the wake of extreme heat events in the UK, the BBC launched a timely and data-informed approach to help audiences better understand the risks of high temperatures and prepare for them. A standout example of this was its interactive map and explainer that explored whether “your postcode area [is] vulnerable to extreme heat?”
Developed during the 2022 heatwave, the feature draws on satellite data from 4 Earth Intelligence – a company that uses satellite data and AI to deliver geospatial insights for environmental and climate solutions – to map how vulnerable each postcode area was to extreme heat in England, Scotland and Wales during periods of hot weather over the past three summers. The location-specific temperature records show how heat extremes are becoming more frequent and severe — not just in the traditionally hotter parts of the country but across all regions.
The interactive tool allows users to input their postcode and immediately view a heat hazard score, ranging from 1 (cooler areas) to 5 (hotter areas). This highly localised insight breaks down the data into understandable terms, helping people visualise the impacts on their daily lives — from health to infrastructure to energy usage.

This form of data journalism represents a powerful bridge between public service broadcasting and public awareness. The BBC combines trusted climate science from the Met Office with its editorial expertise in storytelling and visual explanation.
Importantly, the BBC’s work supports long-term preparedness as much as it aids immediate response. By showing that extreme heat isn’t a distant or occasional issue but one that’s growing in frequency and intensity, it nudges citizens, policymakers, and communities toward more proactive planning. This approach highlights the essential role of public media in delivering clear, localised, and science-based information — tools that help people make informed decisions before, during, and after climate-related disasters.
BBC’s heatwave tracker tool is complemented by a UK heatwave tag, which offers a curated collection of news articles, features, tips, and analyses related to rising temperatures in the UK. It is a hub for audiences seeking information on the causes, effects, and responses to heatwaves.
More from our Caribbean Data Journalism project
Explore our project supporting data journalism for disaster preparedness in the Caribbean, including updates, events, and more.


From start to finish: How ABC keeps Australians safe
The ABC offers a highly trusted Emergency web page, where visual data journalism forms a major aspect. It has been a critical tool for Australians’ preparation and response to events nationwide, such as the extreme bushfire season of December 2019 to January 2020. A research study indicated that during this, audiences predominantly turned to ABC, with some maintaining that their coverage “saved lives”.
In particular, the interactive map of active incidents, allows users to view any immediate hazards or weather events in their area through coloured overlays, coordinated by risk or need for action. The map also contains icons which indicates precise areas that are affected by flooding, severe weather warnings, and so on. A function to search by suburb or postcode enables quick use in an emergency. There is also information on the time the map was last updated, and signposting to further information for each identified incident.
The ABC Emergency page also features a Planning and Advice section, which provides information on what to do in a range of scenarios, explanations of disaster-related terms, as well as guidance on how to maintain a connection to ABC Radio and other information channels in an emergency.
Critically, these features expand the time people have to react and aid understanding of what action is required of them – fundamentals to effective disaster response.
Beyond its Emergency page, the ABC makes use of interactive elements, as seen in its coverage of the 2017 Cyclone Debbie. Using data from the Australian Bureau of Meteorology (BOM), ABC created interactive visualisations of live wind speeds in the cyclone zone, allowing people to track the progression and level of risk of the cyclone.
Sourcing from the same BOM datasets, a live update blog, and a live path tracker titled “Where is Debbie now” were also made available, with interactive elements indicating the time and current category observed in the location.


Screenshots from ABC’s interactive map of active incidents. Source: ABC
Floods and facts: How ZDF innovates in the face of climate change
Among the themes covered by ZDFheute on its website, the floods in Germany section is well resourced. Here, ZDF provides the latest news on floods in the European nation, along with information on how the public should prepare before disaster strikes and support they can seek afterwards from disaster management authorities. Notably, the section includes a live “flood ticker” blog that serves as a source of quick news on developing situations.
In regard to its use of data, ZDFheute leverages data to provide important contexts to help citizens understand the background of floods, including explainers on why there are so many “once-in-a-century floods”. This is linked to its wider work on climate change, where data is harnessed to demonstrate the real-life implications of how climate change is progressing. With its interactive ZDFheute Climate Radar, the public broadcaster – through visuals and text explainers – highlights key climate change data, such as Germany’s carbon emissions, annual temperature variations, and trends in global sea level rise. Importantly, the Climate Radar demonstrates to users how climate change affects them locally, with data of how much warmer or colder the months have been over the past 100 years.
Meanwhile, ZDF boasts an environmental editorial team and weather department, both of which use data in their reporting on disaster risks and climate change.
ZDFheute’s use of data journalism reinforces the crucial role of public media in disaster preparedness and response. By combining real-time updates, historical context, and interactive tools, ZDF helps the public stay informed about immediate risks while also understanding broader climate patterns. This approach not only raises awareness but also encourages preparedness by giving people the information they need to make informed decisions and to hold their elected officials to account. Through its data-driven reporting, ZDF ensures that citizens have access to reliable insights before, during, and after disasters, strengthening resilience in the face of future crises.
Tracking the path: How PBS saves lives from hurricanes
In the United States, PBS stands out for its clear and accessible use of live tracking tools during major weather events, particularly hurricanes. Over the years, the public broadcaster has made several live hurricane trackers available, such as those for hurricanes Milton, Francine, and Dorian. These live maps allow users to track a storm’s real-time location, projected path, wind speed, and intensity. They also provide information on potential storm surge and areas likely to be affected — critical for those making decisions about evacuation, shelter, or preparation.
The trackers were often featured alongside larger stories on their impacts on infrastructure and people. For instance, for Hurricane Ida in 2021, PBS NewsHour embedded the tracker directly into its coverage, offering continuous updates and linking users to additional emergency information, such as guidance from state and federal agencies, and providing local news perspectives.
Collaboration is also a central pillar in PBS’ approach to data for disaster risk preparedness and response. For example, PBS collaborates with FEMA (Federal Emergency Management Agency) on the PBS Warn initiative. PBS WARN — an acronym for Warning, Alert, Response Network — capitalises on the broadcaster’s “unique reach, reliability, and local connections across America to provide a vital backup path for the [wireless emergency alerts] system”. The system enables local, state, and national government agencies, such as FEMA, to instantly send short message warnings from geo-targeted cell phone towers directly to a nearby user’s mobile device. PBS WARN also includes a live map where you can see all active Wireless Emergency Alerts (WEAs) in the US.
The value of such tools is not just in real-time tracking but in reinforcing a sense of readiness and agency. In moments of uncertainty, the ability to clearly see where a storm is headed and what risks it brings can be life-saving.
Turning the lens to the Caribbean
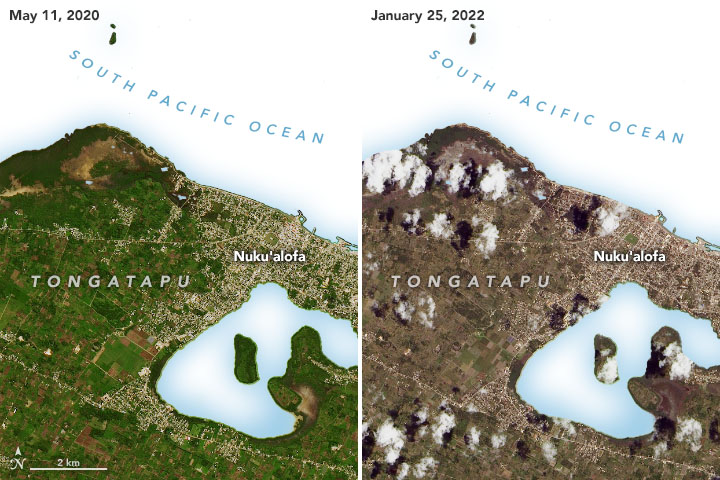
In the Caribbean, examples of data-driven journalism for disaster risk reduction do exist, but they are less visible and less frequent than in other parts of the world. Platforms like Climate Tracker Caribbean have produced insightful, data-informed stories on climate action and environmental shifts in the region. But such initiatives are largely driven by NGOs or individual reporters, rather than being embedded within broader public service and public interest media efforts.
This is particularly concerning given the region’s acute vulnerability to the effects of climate change. Rising sea levels, stronger hurricanes, flash floods, and droughts are all intensifying risks for Caribbean communities. In this context, the ability to collect, analyse, and communicate reliable data — and to do so in ways that people can easily access and understand — is not a luxury but a necessity.
But reporting in this space is not without challenges, and these are not unique to the Caribbean. Financial pressures within news organisations often limit the resources needed for data journalism, from data analysis skills training, to involving specialists such as graphic designers and developers. Complex datasets pose another issue: journalists must find a balance between clarity and accuracy, avoiding oversimplification while ensuring the information is accessible to the public. At the same time, many journalists operate in high-stress environments, where unpredictable disasters, personal safety risks, and competing coverage demands make it difficult to prioritise long-term data work, especially without the backing of larger, well-resourced teams.
As part of our efforts to better incorporate data journalism into disaster risk preparedness and response, the Public Media Alliance (PMA) will kick off its “Data Journalism in Action: Empowering Caribbean Disaster Preparedness” project in May 2025. The upcoming project, benefiting journalists from Barbados, Grenada, and Trinidad & Tobago, is supported by the UNESCO Office for the Caribbean and UNESCO’s International Programme for the Development of Communication (IPDC), and is in partnership with the France-based non-profit organisation, HEI-DA.
This initiative will equip 12 journalists with the skills to harness data for impactful disaster preparedness reporting. The project begins with a three-day hackathon in May, where journalists will be introduced to data journalism techniques tailored to disaster preparedness. This will be followed by virtual training sessions on storytelling, verification, and ethical data use. Journalists will then develop and pilot their projects over the course of several months, benefiting from ongoing mentorship and culminating in a regional showcase to present their work to key stakeholders.
Project partners
The project is being implemented by the Public Media Alliance in collaboration with HEI-DA, a media development non-profit specialising in data journalism. It is supported by the UNESCO Office for the Caribbean and UNESCO’s International Programme for the Development of Communication (IPDC). Learn more about this initiative.

Related Posts

“Data is about humans more than the numbers”: HEI-DA founder on bringing data journalism to the Caribbean with PMA
HEI-DA’s Marianne Bouchart on mentoring…

Data Journalism for Caribbean Disaster Preparedness: Meet the Fellows
Meet the fellows of the upcoming…

Meet the team leading our Data Journalism for Disaster Preparedness project
Meet our partner and the facilitating…
UNESCO, PMA to partner on new data journalism project in the Caribbean
PMA's new project in the Caribbean aims…