By Aurora Herrera
How a team at the BBC World Service is revamping our visual grasp of elections and offering digestible information for all
The BBC World Service Visual Journalism team has taken on the formidable challenge of multimedia storytelling across numerous platforms including television, tablets, mobile phones and desktops. The team combines graphic tools with journalistic rigour to conjure powerful visuals, which aid the audience in processing information to facilitate a deeper understanding of the news and informed decision making.
The team unites graphic designers, online journalists, developers, craft editors and TV designers and works on various projects with the World Service languages division.
One example of the success of this collaborative, cross-department public media initiative, is their coverage of the 2018 Afghan elections. Afghanistan had not held parliamentary elections in eight years and has a particularly complex and difficult-to-navigate voting system. The team’s role was to make the results as accessible and understandable as possible.
How does it work?
Josh Rayman, a designer who makes election graphics and other interactive features for the BBC World Service, worked with Leoni Robertson, a data journalist who researched population statistics to determine the eligible voting population in Afghanistan. Then there was Alice Grenié who transformed the rough data visualisations Rayman made and created the design for website and TV. Haroon Shafiqi and the BBC Pashto team provided data, context and created video content using the dashboard for BBC Pashto. Mariam Aman and Zia Shahreyar of the BBC Persian TV team then presented the project outcomes on a studio touchscreen during their live election day coverage.
“Our team usually works on commission from the different language services in the BBC that we work for, but last year we decided to take an active lead in elections coverage,” Rayman said. “This allowed us to start work on it earlier and create a more complex interactive project. We work very closely together, taking advantage of the fact that on each project it’s one data journalist, one designer and a developer, which means we can iterate quickly and sometimes build things that don’t end up being used, to see what works on the page.”
The team set out to study, capture and present the details of the voting system, creating bespoke graphics that would deconstruct the complexity of the voting system
The team set out to study, capture and present the details of the voting system, creating bespoke graphics that would deconstruct the complexity of the voting system and enable all interested parties to understand what candidates were offering as well as how they were progressing.
“We didn’t have a fixed idea of what the project would look like – when we started it was a case of looking at the data and finding out what might be interesting about it,” Rayman said. “Our projects have a long lead time in terms of data preparation and the early designs but tend to come together quite quickly once the build phase starts – about a month. Our testing focuses on the technical functionality, but the Afghan election dashboard was user tested in the Kabul office.”
The team began their preparation well in advance, conducting data analyses before approaching the language teams for support in terms of seeking out interesting stories to provide context. Rayman downloaded the raw data of the previous parliamentary election from the Independent Electoral Commission of Afghanistan (IEC).
In an article published in Source, Rayman described part of the process: “The raw data didn’t indicate winners, so we created a script that calculated the winning candidates, and accounted for the women’s quota” he said. “We also had candidate gender stats manually calculated by our producer from BBC Pashto who went through all 2,500 candidates to create region-by-region numbers. We aggregated the data using Python (plus pandas) and node.js to make more manageable JSON files for the dashboard. We were able to slot in new data as it arrived over a long period of time, and we could combine the partial 2018 dataset with the existing 2010 data on the fly.”
Utilising research and key knowledge from U.S. and U.K. election coverage the team was able to identify trends including “how the gender-segregated polling stations voted and how this data changed between 2010 and 2018.”
“This created talking points and ideas for social media cards,” Rayman said. “Some of the graphics and data points we created were for our own understanding of the vote, and others were used in the touchscreen broadcast on BBC Persian TV and on the BBC News website.”
Providing clarity
The outcome produced content that could be used by the public to achieve a greater understanding of the election.
“I was really pleased that the groundwork we did early on in the project paid off – taking the time to understand the electoral systems meant we could work with the journalists and collaborate on making a better product,” Rayman said.
In the article published in Source, Rayman also comments on how the graphics were used. “These graphics were used on the election dashboard with 2010 data and also repurposed into a scrollytelling format explaining the 2018 results. From these graphics, we created talking points for TV, created social media graphics, and offered an alternative visual format to the one offered by the election commission.”
“These graphics were used on the election dashboard with 2010 data and also repurposed into a scrollytelling format explaining the 2018 results. From these graphics, we created talking points for TV, created social media graphics, and offered an alternative visual format to the one offered by the election commission.”
When asked about the role public broadcasters play in the development of such tools, Rayman praised the World Service 2020 project. ‘I think the World Service 2020 project absolutely helped this type of development – the fact that we are covering elections across the world means that components and tools have been abstracted and reused across the many language services that are working in many different regions – for example, components we contributed were used and shared widely in the Brazilian and Nigerian elections,” he said.
According to Rayman the team is currently working on devising “more ways to explore electoral data and getting ready for the Afghan presidential vote in the autumn!”
With the BBC World Service 2020 project, the UK government has committed “to invest £85m a year in enhancing BBC services around the world including in Russia, North Korea, the Middle East and Africa.” The fund is intended to help the BBC achieve their target of reaching half a billion people globally. Their reach currently extends to 308 million.
Accoring to a report by the BBC, this boost will “help the BBC deliver on [their] commitment to uphold global democracy through accurate, impartial and independent news reporting.”
When well-funded, it is the duty of public service media organisations to continue to find innovative ways to tell stories that will appeal to every person within their reach to ensure that knowledge and the power to make informed decisions continues to serve as the building blocks of a democratic society.
Header Image: BBC Pashto presenter Haroon Shafiqi showcasing a special electoral map for the 2018 election in Afghanistan. Credit: BBC Pashto/YouTube
Related Posts
15th March 2019
Best of PSM | Radio France and Radio Canada unite on a quest for innovation
Through an idea accelerator, the two…
3rd December 2018
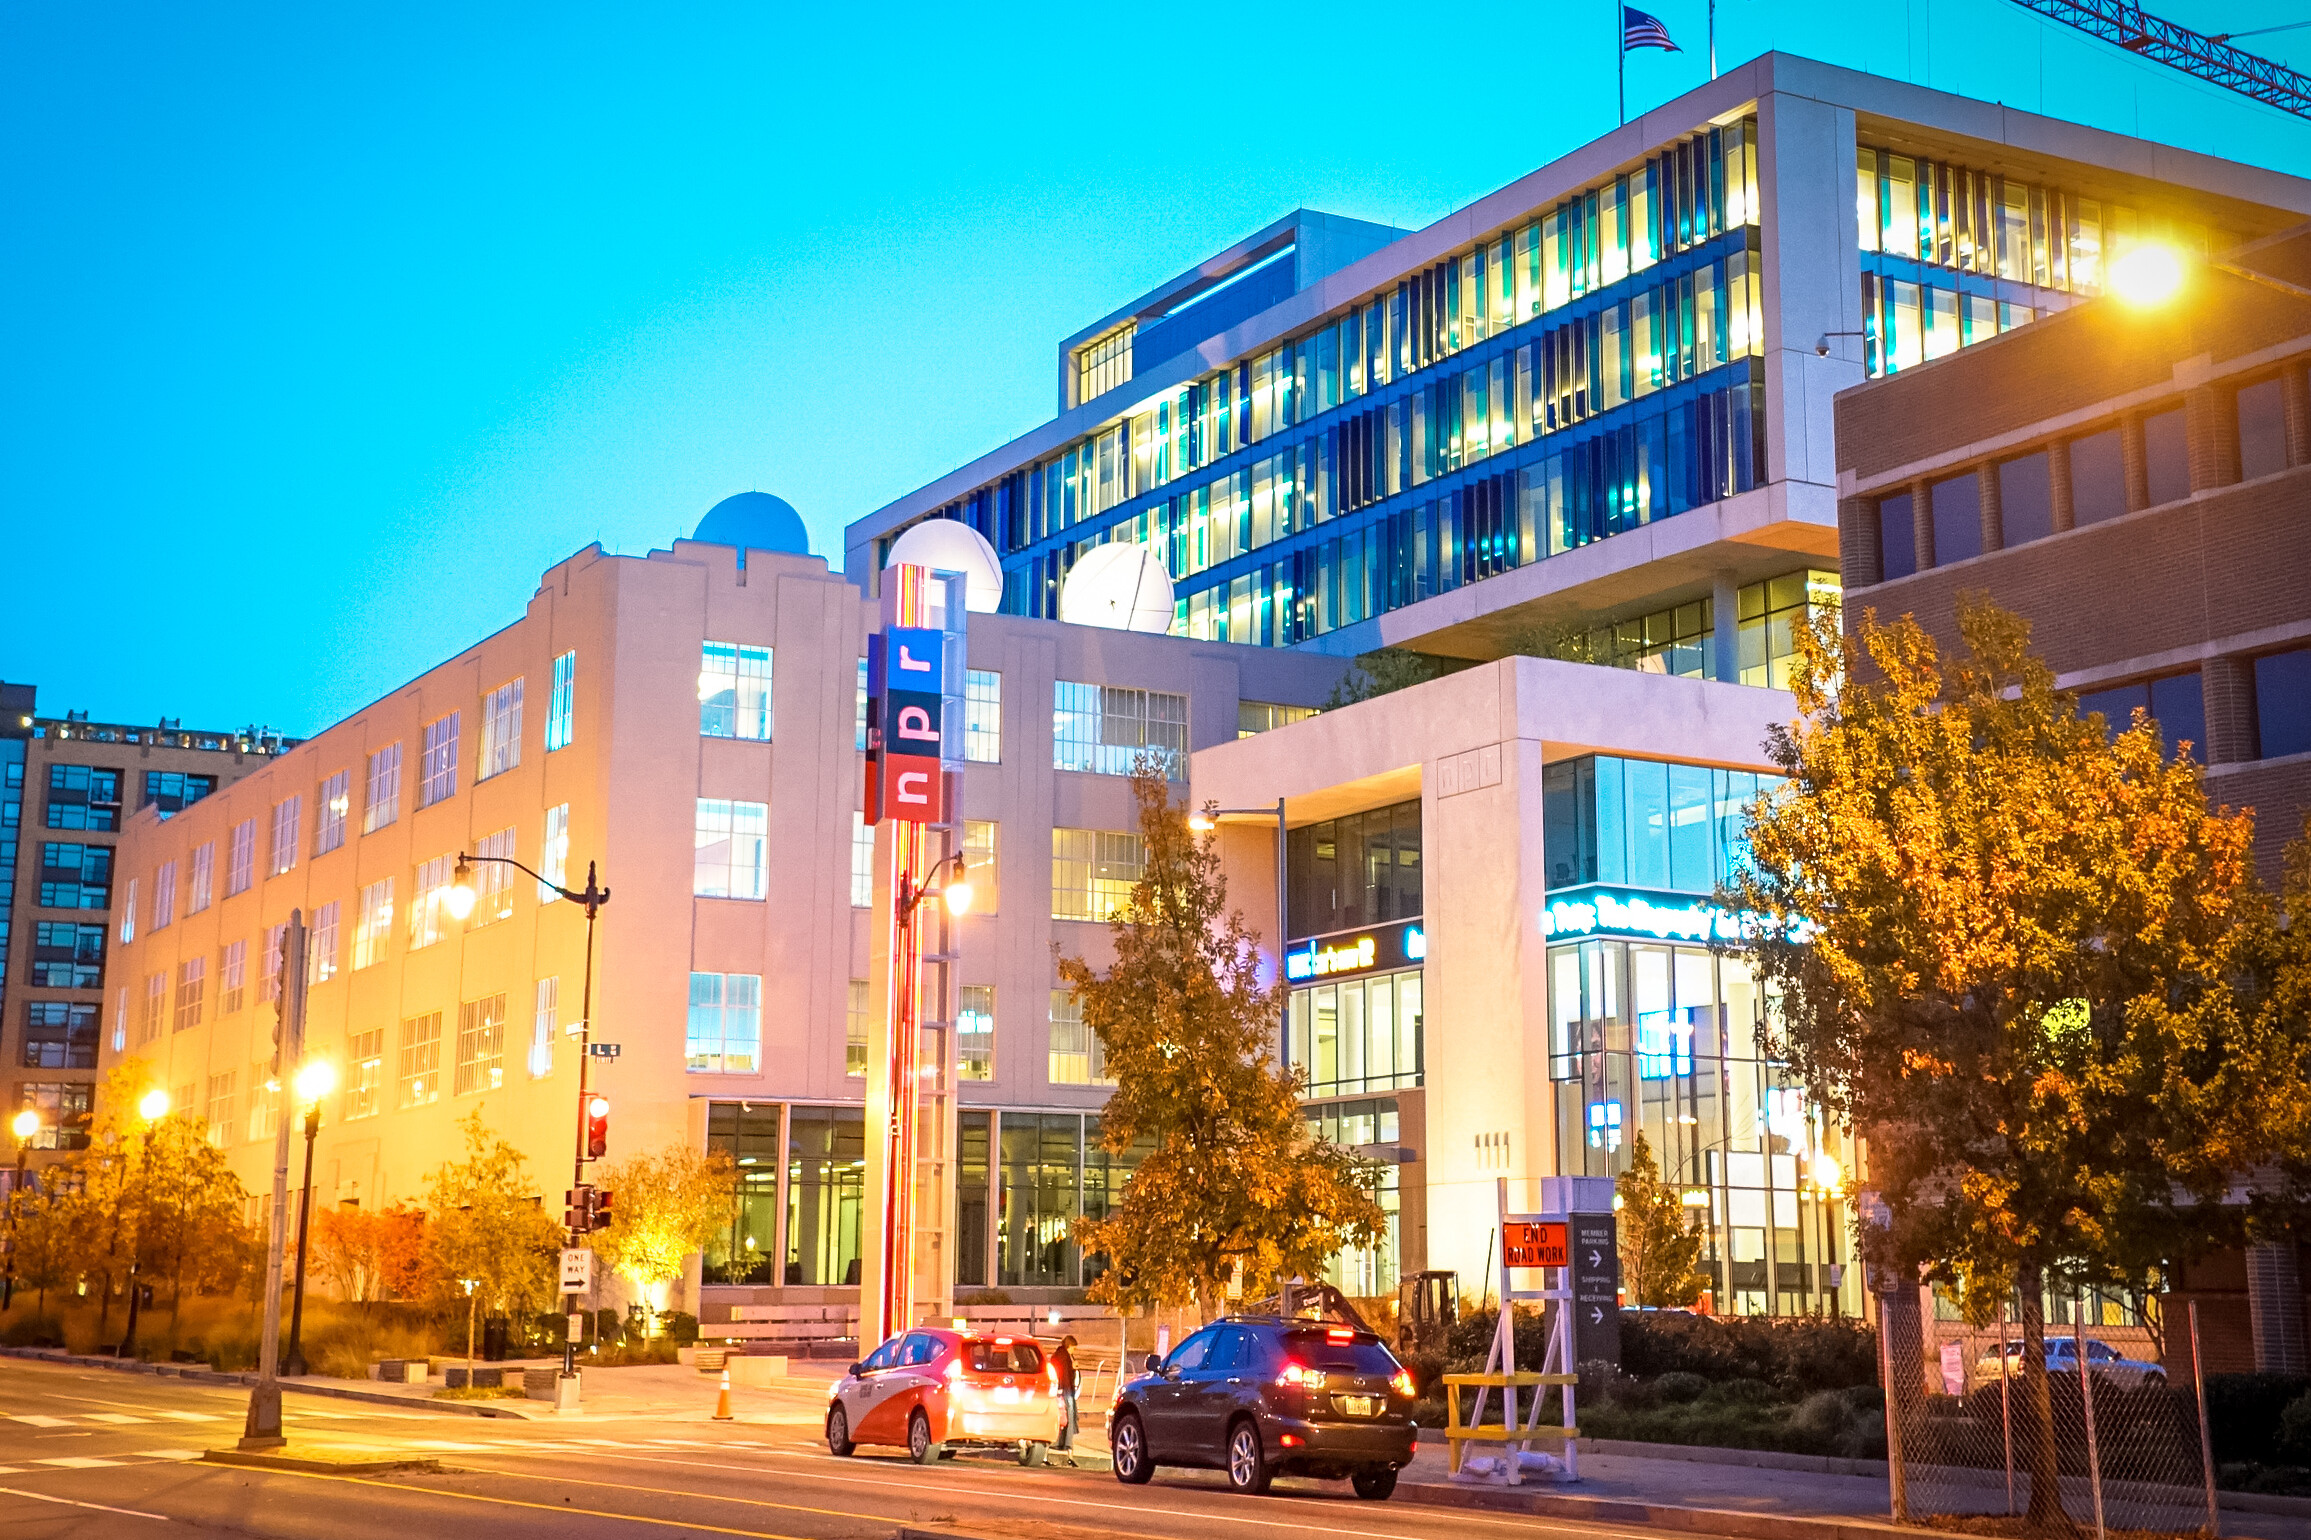
Best of PSM | NPR engaging younger audiences
Public radio in the US engages students…
23rd November 2018
Best of PSM | VRT’s Taboe – ’Laughing at things you should not be laughing at’
How a mix of human interest stories and…